CellTiter-Glo® 3D Cell Viability Assay

A Cell Viability Assay Validated for 3D Microtissue Cultures
- Formulated specifically for 3D cell culture models, where standard viability assays underperform due to incomplete lysis
- Simple 30-minute protocol with a single ready-to-use reagent
- Excellent assay precision, suitable for high-throughput 3D drug screening
Catalog Number:
Size
Catalog Number: G9681
Catalog Number: G9682
Catalog Number: G9683
What Is the CellTiter-Glo® 3D Cell Viability Assay and How Does It Work?
少数細胞での細胞毒性モニタリング
LDH-Glo™ Cytotoxicity Assay は細胞膜損傷により培地に放出される乳酸脱水素酵素 (LDH) をプレートベースで発光測定します。発光による測定は発色法や蛍光法に比べて高感度検出を可能にするため、少数の細胞 (初代培養細胞や3D細胞培養を含む)から漏出する LDH でも正確に検出することができます。
このアッセイでは処理後の各ウェルより極少量の培地 (2–5µl) を使用するだけなので、長時間にわたり同じウェル中のサンプルからより多くのデーターを取得できることができ、残った培地や細胞を利用して他の細胞ベースアッセイを行うこともできます。
【簡易マニュアル】日本語
※日本語マニュアルは英語版を翻訳したものですが、常に更新されるものではありません。最新のマニュアルについては以下の ”Complete Protocol” をご覧ください。
Discover how automated 3D culture workflows using the CellTiter-Glo® 3D Cell Viability Assay on the MO:BOT system delivers a robust solution for assessing 3D spheroid and organoid viability.
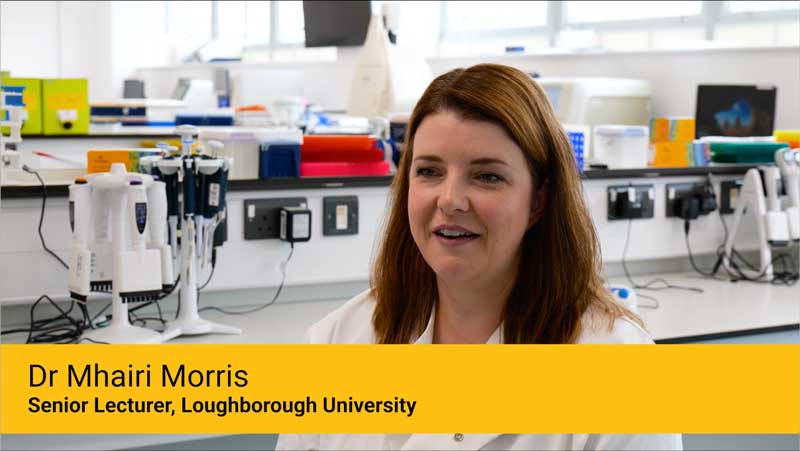
Case Study
Challenge:
Dr. Mhairi Morris, Senior Lecturer at Loughborough University, studies the relationship between fat cells and cancer. She needed a less variable solution than MTT assays to model interactions between cells in a 3D environment.
Result:
Using the CellTiter-Glo® 3D Assay, she was able to transition from 2D to 3D models, giving a more accurate picture of how visceral fat and subcutaneous fat interact with cancer cells.
Because the 3D environment is more biologically relevant and the assay measures ATP released from viable cells, she's seeing less variability in her results. Additionally, the simple protocol means she's saving time and effort she can devote to her research.
How Much Better Is ATP Recovery in the CellTiter-Glo® 3D Assay vs. the Standard Assay?
アッセイの原理
ダメージを受けた細胞から漏出した LDH は、NAD+ から NADH への還元を伴い乳酸の酸化を触媒します。レダクターゼは NADHと基質を用いてルシフェリンを生成し、これが Ultra-Glo™ rLuciferase により生物発光シグナルに変換されます。How Sensitive Is the CellTiter-Glo® 3D Assay Compared to Other Viability Assays?
3D 細胞培養における細胞毒性のモニタリング
LDH-Glo™ Cytotoxicity Assay は細胞膜を損傷した少数の細胞から漏出する LDH の測定に最適です。 HCT116 スフェロイドで薬剤による毒性試験の例を示します。時間依存的な細胞毒性は同じウェルから繰り返しサンプリングした培地より測定しました。How Does the CellTiter-Glo® 3D Assay Compare to Other Lytic Assays that Measure ATP?
Improved 3D Microtissue Penetration, More Accurate Viability Data
HCT116 colon cancer spheroids were generated by seeding cells in the InSphero GravityPLUS™ 96-well hanging-drop platform and grown for 4 days.
Panel A. An equivalent volume of reagent was added to all samples, and after 5 minutes of shaking, luminescence was recorded at 30 minutes.
Panel B. A 2X concentration of CellTox™ Green Dye was added to CellTiter-Glo® 3D Reagent (left) or ATPlite™ 1Step Reagent (right) prior to sample addition as an indicator of cell lysis and images were acquired at 30 minutes. The spheroids in Panel B are ~300μm in diameter, and the bars in each image represent a distance of 200μm.

Is the CellTiter-Glo® 3D Assay Suitable for High-Throughput Drug Screening?
Yes. The CellTiter-Glo® 3D Assay has been validated for use in high-throughput 3D drug screening with demonstrated assay precision meeting HTS quality thresholds.
Z′-Factor Performance in 3D Spheroids
Four hundred HCT116 colon cancer cells were seeded into each of 60 wells of a 96-well InSphero GravityPLUS™ hanging-drop plate and incubated for 4 days to form 60 spheroids (~350μm in diameter). Half of the spheroids were treated with 100μM panobinostat (gray squares), and the other half were treated with vehicle (1% DMSO, orange squares). After 48 hours, all samples were assayed with the CellTiter-Glo® 3D Reagent. The CellTiter-Glo® 3D Assay provided a Z´-factor of 0.81.

What 3D Culture Formats Are Compatible?
ADCC アッセイでのターゲット細胞の細胞毒性検出
LDH-Glo™ Cytotoxicity assay は 補体依存性細胞傷害 (CDC)、抗体依存性細胞媒介性細胞傷害 (ADCC) や抗体-薬物複合体の細胞毒性などバイオロジクス処理の作用機序にともなう様々な細胞死の評価に使用することができます。生物製剤 リツキシマブ を用いたターゲット細胞の ADCC細胞死の検出にLDH-Glo™ Assayを用いた例を示します。


HCT116 colon cancer cells were seeded as follows: 400 cells in hanging-drop; 1,000 cells in ULA or Matrigel®. Microtissues were grown for 4 days, treated with compounds for 48 hours, and then assayed with the CellTiter-Glo® 3D Reagent. Luminescence was recorded at 30 minutes.
Tools to Monitor Biology in 3D Culture
When working with 3D culture models, choosing the right assay system is crucial. Learn about tools to monitor biology in 3D culture.
Protocols
Complete Protocol
Quick Protocols
Frequently Asked Questions
How does the CellTiter-Glo® 3D Assay differ from the standard CellTiter-Glo® Assays?
The table below summarizes the key differences between the standard CellTiter-Glo® Assays (for 2D monolayers) and the CellTiter-Glo® 3D Assay, incorporating validated performance data from Promega internal studies.
| Factor | Standard CellTiter-Glo® Assays (2D) | CellTiter-Glo® 3D Assay |
|---|---|---|
| Culture model | Monolayer (adherent or suspension) | Spheroids, organoids, 3D matrix cultures |
| Reagent format | Two-component (original) or ready-to-use (2.0) | Single ready-to-use reagent with enhanced lysis buffer |
| Lysis mechanism | Standard detergent lysis; effective for monolayers | Enhanced lysis buffer validated to penetrate dense 3D structures |
| ATP recovery (large spheroids) | Underestimates | Higher recovery |
| Incubation time | 10 minutes | 30 minutes |
| Sensitivity | Highly sensitive luminescent readout | Highly sensitive luminescent readout |
| 3D culture format compatibility | Not validated for 3D | Validated: hanging-drop, ULA plates, Matrigel®—equivalent results across all three |
| HTS compatibility | Yes—96/384/1536-well formats | Yes—validated in 96- and 384-well ULA formats |
What are the most common methods for measuring cell viability in 3D cultures?
Several assay platforms can be adapted for 3D viability measurement, each with distinct trade-offs between sensitivity, throughput, spatial resolution and assay time. CellTiter-Glo® 3D Assay performance data are included for direct comparison.
| Method | Principle | Key Strengths | Key Limitations |
|---|---|---|---|
| ATP luminescence (CellTiter-Glo® 3D) | Quantifies intracellular ATP via luciferase after enhanced lysis | Highest sensitivity; 30-minute protocol; Z′ = 0.81 in 3D HTS; HTS-compatible | Endpoint/destructive; no spatial information |
| Live/dead fluorescence (Calcein-AM/EthD-1) | Membrane-permeable dye stains live; exclusion dye stains dead cells | Spatial viability map; nondestructive option | Requires imaging; depth-of-field limits in large spheroids |
| Metabolic/colorimetric (MTT, alamarBlue®) | Metabolic reduction to colored/fluorescent product | Nondestructive (resazurin); low cost | 3- to 8-hour assay time; signal only modestly above background in 3D; poor penetration in compact spheroids |
| Flow cytometry | Single-cell analysis after spheroid dissociation | High resolution; multi-parameter | Requires dissociation; loses spatial context; low throughput |
| Confocal/light sheet imaging | 3D spatial fluorescence microscopy | Full 3D spatial and temporal viability data | High equipment cost; complex analysis; slow throughput |
Can I use standard CellTiter-Glo® Assay or CellTiter-Glo® 2.0 for 3D cell cultures?
The standard CellTiter-Glo® Assays are not recommended for compact 3D spheroids due to incomplete lysis. Use the CellTiter-Glo® 3D Cell Viability Assay because it is specifically optimized for 3D models.
How sensitive is the CellTiter-Glo® 3D Assay compared to other viability assays?
ILike other luminescent assays, the CellTiter Glo® 3D Assay has very low background, so it typically produces optimized signal to background ratios in the tens to thousands range. In comparison, fluorescence- or absorbance-based viability assays often generate signals only a few fold above background.
What is the Z′-factor for CellTiter-Glo® 3D Assay in high-throughput 3D screening?
The CellTiter-Glo® 3D Assay achieved a Z′-factor of 0.81 in a 96-well 3D precision experiment using HCT116 colon cancer spheroids (~350μm diameter). Thirty spheroids were treated with 100μM panobinostat (positive control) and 30 with vehicle (negative control). A Z′-factor above 0.5 is the accepted HTS threshold; 0.81 indicates excellent assay window separation, confirming suitability for high-throughput 3D drug screening.
Which 3D culture formats are compatible with CellTiter-Glo® 3D?
CellTiter-Glo® 3D Assay has been validated across three major 3D culture formats with equivalent dose-response results in all three: hanging-drop cultures (InSphero GravityPLUS™ platform), ultra-low attachment (ULA) round-bottom plates, and Matrigel® 3D cultures. All formats used HCT116 colon cancer cells grown for 4 days and treated with compounds for 48 hours before assay.
Are there protocol differences between CellTiter-Glo® 3D Assay and the standard assay?
Yes—three modifications are required for 3D cultures: (1) add reagent at 1:1 volume ratio with culture medium (same as standard), but mix more vigorously for 5 minutes rather than 2 minutes; (2) incubate for 25–60 minutes rather than 10 minutes to allow the enhanced lysis buffer time to fully penetrate the 3D structure; (3) equilibrate both the plate and reagent to room temperature for 30 minutes before addition. Total assay time from reagent addition to read is 30 minutes for standard spheroid sizes.
What alternatives exist to CellTiter-Glo® 3D Assay for 3D viability measurement?
Alternatives include: fluorescent live/dead staining (e.g., Calcein-AM/EthD-1) for spatial viability maps requiring imaging; resazurin-based assays (alamarBlue®) as nondestructive options with lower sensitivity in 3D and a 3-hour protocol; and ATPlite™ 1Step (PerkinElmer), which uses standard lysis chemistry that provides inferior penetration and ATP recovery compared to the CellTiter-Glo® 3D Assay in compact spheroids. For kinetic monitoring in 3D, the RealTime-Glo™ MT Assay is a non-lytic option that requires experimental validation in each 3D model.
How do CellTiter-Glo® 3D Assay results compare to 2D viability data for the same compound?
IC₅₀ values from 3D spheroids are typically higher than those from 2D monolayers for the same compound, reflecting the more physiologically relevant drug microenvironment in 3D. Quiescent cells in the spheroid interior are less susceptible to antiproliferative agents, and diffusion barriers limit drug penetration to inner cell layers. This makes 3D IC₅₀ values more predictive of in vivo activity, and the difference is a biologically meaningful feature rather than an assay artifact.
Why do drug responses differ between 2D and 3D models?
3D tumor spheroids replicate in vivo tumor microenvironments more closely than monolayers, including oxygen and nutrient gradients, cell-cell and cell-matrix interactions, and the emergence of hypoxic cores in larger spheroids. These biological features produce drug responses that often differ from 2D data: IC₅₀ values are typically higher (lower apparent potency) in 3D, and some compound classes that appear active in 2D show reduced activity in 3D when the target requires dividing cells or relies on efficient tissue penetration. This is considered a feature of 3D models—the data are more predictive of in vivo compound activity.
What plates and readout settings are recommended?
Solid white opaque plates are best for reading. Grow spheroids in clear U-bottom/low-attachment plates if needed, then transfer lysates to opaque solid white plates for reading. Use a luminometer with top-read and no emission filter to maximize signal and minimize cross-talk. Most standard luminescence settings are suitable and the signal is stable so you can test to find what gives you the best signal above the background
How do I optimize lysis and shaking for 3D cultures?
Ensure vigorous but spill-free shaking (start around 450 rpm) and extend mixing/incubation until signal plateaus. For large or dense 3D samples, perform ATP recovery experiments as described in Technical Manual #TM412.
Can the CellTiter-Glo® 3D Assay be used with tissues or non-3D samples (pellets, suspensions, tissue material)?
This assay can be used with cell pellets and suspension cells. Researchers outside of Promega have tried it on small tissue pieces, but these applications are not fully validated. Large spheroids, tissues and collagen or other complex matrices require case-by-case optimization and may not be suitable. Perform ATP recovery experiments as described in Technical Manual #TM412.
What are the limitations of the CellTiter-Glo® 3D Assay?
Understanding these limitations supports appropriate experimental design:
- The reagent penetration and ATP recovery decrease as microtissues become large, but for small to moderate size spheroids (~350µm or less), penetration and recovery are excellent. Very large or highly compact spheroids (>350μm) may require extended incubation and additional vortexing.
- Endpoint/destructive—cell lysis prevents kinetic monitoring. For continuous real-time viability in 3D, the RealTime-Glo® MT Assay requires separate validation for each 3D model.
- No spatial viability information—the assay reports total viable ATP from the full spheroid but cannot reveal necrotic core vs. viable rim distribution. Complement with live/dead fluorescence imaging when spatial context is needed for mechanistic interpretation.
- Matrix interference—Matrigel® and other hydrogel matrices may impede reagent penetration at high concentrations. Run matrix-only controls to characterize background ATP contribution and confirm equivalent lysis efficiency vs. non-matrix formats.
- Luciferase inhibitor compounds—some library compounds directly inhibit luciferase activity, generating false-positive cytotoxicity signals. Screen at the highest tested concentration with a luciferase counter-assay or ATP spike if compound interference is suspected.
Specifications
Catalog Number:
選択製品の構成品内容
| Item | Part # | Size |
|---|---|---|
CellTiter-Glo® 3D Reagent |
G968A | 1 × 10ml |
選択製品の構成品内容
| Item | Part # | Size |
|---|---|---|
CellTiter-Glo® 3D Reagent |
G968A | 10 × 10ml |
選択製品の構成品内容
| Item | Part # | Size |
|---|---|---|
CellTiter-Glo® 3D Reagent |
G968B | 1 × 100ml |
Related Products
類似製品
CellTiter-Glo® 2.0 Cell Viability Assay
試薬の安定性が向上したCellTiter-Glo®、ATP検出に基づく細胞増殖の定量が可能
G9241, G9242, G9243
CellTox™ Green Cytotoxicity Assay
細胞死に伴う細胞膜破壊により細胞毒性を蛍光で測定
G8741, G8742, G8743, G8731
Caspase-Glo® 3/7 3D Assay
3D培養中のカスパーゼ-3/7活性を測定するシンプルな発光アッセイ
G8981, G8982, G8983
GSH/GSSG-Glo™ Assay
培養細胞中の総グルタチオン(GSH +GSSG)、GSSG または GSH/GSSG 比を測定するための発光アッセイ
V6611, V6612
Resources
技術記事
- Reproducible Drug Screening Assays Using Single Organoids
- Verifying Cell-Based Assays for Use with 3D Models
- Luminescent Viability Assays for Magnetically Bioprinted Hepatocyte Spheroids
- App Note: Predicting gastrointestinal toxicity
- Enhanced extrinsic apoptosis of therapy-induced senescent cancer cells using a death receptor 5 (DR5) selective agonist
- Lipidomics profiling reveals differential alterations after FAS inhibition in 3D colon cancer cell culture models
- ALDOC- and ENO2- driven glucose metabolism sustains 3D tumor spheroids growth regardless of nutrient environmental conditions: A multi-omics analysis
- High-pressure oxygen rewires glucose metabolism of patient-derived glioblastoma cells and fuels inflammasome response
- Delivery of a BET protein degrader via a CEACAM6-targeted antibody–drug conjugate inhibits tumour growth in pancreatic cancer models